
Synapse Analytics
LIVE CLUSTER // 100k events/sec
Active Cluster Nodes
38.4k
+12.5%
Ingested Pipeline Volume
$245,670
+9.8%
Processing Efficiency
4.2%
+0.5%
Error Rate (p99)
0.01%
-0.2%
Real-Time Throughput & Pipeline Load
45k40k35k30k20k15k10k5k0
$300k$250k$200k$150k$100k$50k0
1357911131517192123252830
Observation Window
Worker Node Allocation
Pipeline Volume by Cluster
Event Ingestion Pipeline
Raw Events
Schema Validation
Enriched Telemetry
Persisted to OLAP
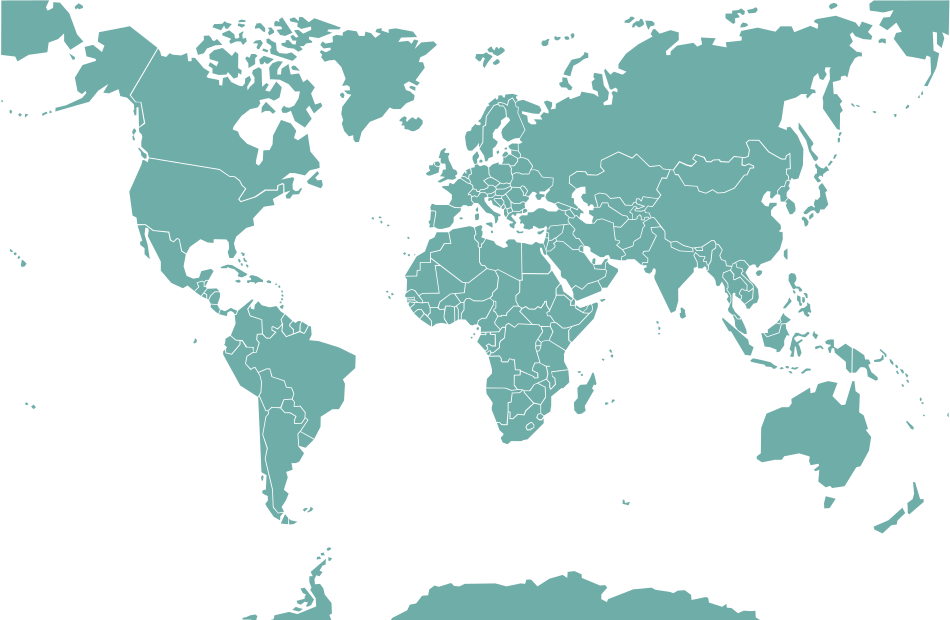
Global Edge Node Topology
Protocol Distribution
10%
45%
28%
17%
gRPC Streams
Kafka Direct
WebSockets
REST Ingest
Cluster Ingestion Batches
| Status | Timestamp | Source Region | Pipeline | Records |
|---|---|---|---|---|
| Committed | 14:48:02 UTC | AWS eu-central-1 | Direct OLAP | 142,500 ev |
| Buffered | 14:48:00 UTC | GCP us-east4 | Stream Buffer | 38,120 ev |
| Committed | 14:47:58 UTC | Azure westeurope | Direct OLAP | 892,400 ev |
| Reprocessed | 14:47:50 UTC | Cloudflare Edge | Dead Letter Q | 1,210 ev |
Active Campaigns & Emitters
LIVE | Stream Router
Telemetry Source Nodes
| Status | Node ID | Runtime | Payload Ingest | Batches/s | Success Rate | P95 Latency |
|---|---|---|---|---|---|---|
| Operational | SYN-PROD-01 | Rust Tokio Worker | 1.2 GB/s | 14,200 | 99.98% | 14ms |
| Operational | SYN-PROD-02 | Go Fiber Ingest | 850 MB/s | 9,800 | 99.95% | 19ms |
| Rebalancing | SYN-EDGE-LI | Cloudflare Workers | 320 MB/s | 3,400 | 99.40% | 32ms |
| Operational | SYN-ASYNC-TT | ClickHouse Buffer | 4.5 GB/s | 48,000 | 100.0% | 8ms |
| Degraded | SYN-LEGACY-09 | Node.js Ingest | 110 MB/s | 950 | 98.12% | 88ms |
Engine Configuration
Cluster Credentials & Access
Safety Protocols
Automatic Backpressure
Shed traffic when memory > 85%
Strict mTLS Verification
Require client certificates
Zero-Loss WAL Replay
Persist all records before ACK
Telemetry Audits & Artifacts
p99 Latency Audit Q3
Zero-Drop Partition Verify
Edge Routing Benchmarks
WAL Ingestion Footprint
p99_latency_audit_q3.pdf
SYNAPSE ENGINE AUDIT
Live Telemetry Ingestion Stream
Streaming via WebSocket
synapse-stream // cluster-prod-01.internal
[14:45:02] INFO Distributed telemetry engine booted successfully.
[14:45:05] INFO ClickHouse connection established (latency: 1.2ms).
[14:45:12] WARN Rebalancing worker partition 04 (traffic surge detected).
[14:46:45] INFO mTLS handshake verified for node-eu-central-1.
[14:47:22] CRIT Memory watermark touched 82% on ingress buffer-3. Applying backpressure.
[14:47:25] INFO Backpressure resolved. Ingress normalized to 98k events/s.
[14:48:00] INFO Snapshot persisted to S3 cold storage (42.5 GB committed).
Pipeline Throughput Quotas
SLA Threshold: 99.9%
1. Total Ingested
1.24B
Last 24 Hours
2. In Transit
45.2M
In Memory WAL
3. Indexed
1.19B
Sub-second Queryable
4. Dropped Packets
0
Zero Packet Drop SLA
Regional Ingestion Brokers
| Broker Handle | Region | Capacity Load | Processed |
|---|---|---|---|
| Broker-Alpha | EU-Frankfurt | 82% | 420M |
| Broker-Beta | US-Virginia | 64% | 510M |
| Broker-Gamma | AP-Singapore | 48% | 310M |
Bandwidth & Infrastructure Cost
Real-Time FinOps Telemetry
Cluster Cloud Spend / Month
$14,250
-18.4%
Cost Per Million Events
$0.0014
-42.0%
Compute Compression Ratio
8.4x
+1.2x
Compute Footprint by Tier
Edge Filter
$2.4k
Buffer Nodes
$6.2k
OLAP Storage
$5.6k
Geographical Traffic Split
Regional Ingress Share
EU (45%)US (35%)APAC (15%)Other (5%)
Ingress Transport
gRPC Stream68%
HTTP/2 REST24%
WebSockets8%
Cluster System Health
All 4 Clusters Operational
API Gateway
99.9%
ClickHouse OLAP
99.9%
Worker Fleet
98.4%
Edge Replicas
99.9%